General cell culture
The following cancer cell lines were purchased from ATCC: A431 (CRL-1555), A549 (CRM-CCL-185), AGS (CRL-1739), BT549 (HTB-122), BXPC3 (CRL-1687), CACO2 (HTB-37), CAPAN2 (HTB-80), CAOV3 (HTB-75), HCC1954 (CRL-2338), HCC4006 (CRL-2871), HCC827 (CRL-2868), HCT116 (CCL-247), HPAC (CRL-2119), HS578T (HTB-126), HT29 (HTB-38), KatoIII (HTB-103), LS123 (CCL-255), MDAMB468 (HTB-132), NCIH1563 (CRL-5875), NCIH1650 (CRL-5883), NCIH1975 (CRL-5908), NCIH226 (CRL-5826), NCIH358 (CRL-5807), NCIH441 (HTB-174), NCIN87 (CRL-5822), PC3 (CRL-1435), SKBR3 (HTB-30), SKMES1 (HTB-58), SW48 (CCL-231) and SW900 (HTB-59). The following cells were purchased from Accegen: CALU1 (ABC-TC0110), EBC1 (ABC-TC0170) and MKN7 (ABC-TC0688).
The media for all cancer cells were purchased from ATCC and include RPMI-1640 (30-2001), DMEM (30-2002), EMEM (30-2003), F-12K (30-2004), IMDM (30-2005) and McCoy’s 5A (30-2007). All media were supplemented with FBS (10% or 20% final concentration as according to cell line supplier’s recommendation, Thermo Scientific, 10082147) and penicillin/streptomycin (1% final concentration from a 100× stock, Thermo Scientific, 15140163). BT549 cells were supplemented with insulin (Thermo Scientific, 12585-014) at 0.023 U ml−1. HS578T was supplemented with insulin at 0.01 mg ml−1. Cell culture media were filter-sterilized via 0.2 µm Nalgene Rapid-Flow Sterile Disposable Filter Units with PES Membrane, 500 ml capacity (Thermo Scientific, 566-0020) or 1,000 ml capacity (Thermo Scientific, 567-0020). Cells were grown in manufacturer’s recommended media with the following exceptions: MDA-MB-468 cells were grown in DMEM, HPAC in IMDM, SW48 in McCoy’s 5A and SW900 in RPMI-containing medium.
Primary bronchial/tracheal epithelial cells (PCS-300-010), epidermal keratinocytes (PCS-200-011) and cervical epithelial cells (PCS-480-011) were purchased from ATCC. Primary bronchial/tracheal epithelial cells were grown in airway epithelial cell basal medium (ATCC, PCS-300-030) supplemented with a bronchial epithelial cell growth kit (ATCC, PCS-300-040). Primary epidermal keratinocytes were grown in dermal cell basal medium (ATCC, PCS-200-030) supplemented with keratinocyte growth kit (ATCC, PCS-200-040). Primary cervical epithelial cells were grown in cervical epithelial cell basal medium (ATCC, PCS-480-032) supplemented with cervical epithelial growth kit (ATCC, PCS-480-042).
All cells were grown at 37 °C with 5% CO2 in 75 cm2 (Corning, 430641U) or 150 cm2 (Corning, 430825) vented cap sterile cell culture flasks or 15 cm plates (Thermo Scientific, 150468).
Method for generating the osimertinib-resistant HCC827 cells
HCC827 cells were cultured in 500 nM osimertinib. The medium and osimertinib were replaced every 3–4 days. Once the cells began to double in 500 nM osimertinib (around day 35) the concentration was increased to 1 µM. Cells were allowed to expand and then frozen back. Resistance to osimertinib was confirmed in a dose–response assay.
General synthetic information
Riboflavin tetraacetate (RFT) photocatalyst utilized in these studies (Supplementary Fig. 7) was synthesized as previously described14. The iridium photocatalyst and biotin-containing diazirine probe (Ar-PEG3-Biotin) utilized in these studies (Supplementary Fig. 7) was synthesized as previously described13.
Preparation of secondary antibody–photocatalyst conjugate
A 350 µl aliquot of polyclonal goat anti-mouse IgG (Millipore, AP124) or polyclonal goat anti-rabbit IgG (Millipore, AP132) was combined with 50 µl of 1 M sodium bicarbonate buffer (pH 8.5, Thermo Scientific, J60408.AK) in a low protein binding tube. Four microlitres of 100 mM azidobutyric acid NHS ester (prepared in DMSO, Broadpharm, BP-22526) was added and the reaction mixture was incubated for 1.5 h at room temperature in the dark. After 1.5 h, an additional 4 µl of 100 mM azidobutyric acid NHS ester linker was added, and the sample was incubated for 1.5 h at room temperature in the dark. In the meantime, a Zeba Spin desalting column (2 ml column, 40,000 MWCO, Thermo Scientific, 87769 or A57762) was prepared by first removing the storage solution (centrifuged 2,000g for 3 min at 4 °C). The column was then primed by three washes of 1 ml 50 mM Tris pH 7.5 and spun at 2,000g for 5 min at 4 °C after each addition except for the last spin which was extended to 10 min. After the second incubation of antibody and azidobutyric acid NHS ester, the sample was buffer exchanged into 50 mM Tris pH 7.5 using the Tris primed Zeba Spin desalting column and spun at 2,000g for 2 min at 4 °C. The antibody–azide conjugate was transferred to a new tube for click chemistry azide-alkyne cycloaddition of the photocatalyst using the Click-iT Protein Reaction Buffer Kit (Thermo Scientific, C10276). Fifteen microlitres of photocatalyst (from 5 mM stock in DMSO) was added to the antibody–azide conjugate and mixed. Fifteen microlitres of copper sulfate and 15 µl of additive 1 were added and mixed, and the reaction was incubated for 1.5 min at room temperature. Following incubation, 30 µl of additive 2 was added to the reaction mixture and incubated in the dark for 30 min at room temperature. After, the sample was buffer exchanged into DPBS (Thermo Scientific, 14190144) using a Zeba Spin desalting column primed in the same manner as above except with DPBS. In some instances, the conjugated antibodies were spun at 16,000g for 10 min at 4 °C to remove precipitates. The final protein concentration of the secondary antibody–photocatalyst conjugate was determined using the Pierce BCA Protein Assay kit (Thermo Scientific, 23227) according to the manufacturer’s instructions. The photocatalyst concentration was determined by measuring the absorbance (350 nm for Ir and 450 nm for RFT) and compared to a standard curve consisting of known free photocatalyst concentrations. The micromolar concentration of photocatalyst was divided by the micromolar concentration of antibody to determine the antibody:photocatalyst ratio. A ratio of 1:8 was routinely obtained.
Preparation of direct antibody–photocatalyst conjugates
CDCP1 and EGFR-targeted micromapping using directly conjugated antibody–photocatalyst conjugates was performed using EGFR×Fc and CDCP1×Fc binders as well as a non-binding anti-RSV×Fc control (Supplementary Fig. 32). All antibodies were produced in ExpiCHO-S cells (Thermo Scientific, A29127) in ExpiCHO expression medium (Thermo Scientific, A2910001). These were purified using an AKTA pure with Unicorn v7.10 SP1 software. All samples were first purified using PrismA HiTrap affinity capture (Cytiva, 17549854), neutralized with 1 M NaPi pH 7.0 and followed by size-exclusion chromatography (SEC) purification over a Superdex 200 increase (Cytiva, 28990944) in PBS (Fisher Scientific, SH3025602). Four antibodies were produced in-house; an anti-EGFR (cetuximab, sequence obtained from US patent 7,060,80861), anti-CDCP1 clone 41A9 (sequence obtained from US patent 11,702,48162) anti-RSV (sequence obtained from https://go.drugbank.com/drugs/DB00110) and an antibody fragment referred to as ‘Fc’ which is comprised of a human IgG1 antibody sequence from just above the hinge (E215) to the C terminus (G446). Each of these carried mutations in the CH3 domain specific for conducting Fab arm exchange63. The Fc antibody was directly conjugated with azide by buffer exchanging antibody into PBS using Zeba desalting columns. 10% v/v of 7.5% NaHCO3 was added to adjust the pH (Hyclone, sh30033.01). 3-Azidopropanoic acid NHS ester (Broadpharm, BP-23800) was prepared to 50 mM stock solution in DMSO. 20 molar equivalents was used as a challenge ratio and added to the solution for 90 min on a shaker platform protected from light. Sample was buffer exchanged into PBS using Zeba desalting columns to remove excess azide. Fab arm exchange was then performed on the azide conjugated Fc with each of the targeting arms (EGFR, CDCP1 and RSV). Equimolar amounts of each antibody were added to the reaction and adjusted to a 25 mM concentration of 2-mercaptoethylamine-HCl (2-MEA, Sigma-Aldrich, 30078). The samples were incubated at 37 °C for 2 h, then buffer exchanged with PBS to remove 2-MEA. This azide labelling of the Fc approach allows for high-throughput production of azide conjugated bispecifics while ensuring there is no disruption to the binding sites on the targeting arm.
Two hundred microlitres of 10 µM targeting arm×Fc-azide antibody was covalently conjugated to the photocatalyst using the Click-iTTM Protein Reaction Buffer Kit and purified using a Zeba Spin desalting column as described above. An isotype control (anti-RSV) was prepared in parallel using the same protocol. The final protein concentration of the direct antibody–photocatalyst conjugate was determined using the Pierce BCA Protein Assay Kit – Reducing Agent Compatible (Thermo Scientific, 23250) according to the manufacturer’s instructions. The photocatalyst concentration was determined as described above. Ratios of 1:9 and 1:5 were routinely observed for Ir and RFT, respectively.
Flow cytometry analysis of target proteins
Cells were collected with Accutase (BioLegend, 423201), centrifuged at 800g for 5 min at 4 °C, resuspended in DPBS, counted using a Beckman Coulter Vi-CELL XR Cell Viability Analyzer and aliquoted at 200,000 cells per well in a 96-well U-bottom plate (Fisher, 351177) in 100 µl DPBS. One hundred microlitres of DPBS containing LIVE/DEAD Fixable Near-IR Dead Cell Stain (Thermo Scientific, L10119) at a 1:1,000 dilution was added to the cells and then incubated for 30 min at room temperature in the dark. The cells were centrifuged at 800g for 5 min at 4 °C and washed once with 200 µl fluorescence-activated cell sorting (FACS) buffer (DPBS containing 2% FBS and 2 mM EDTA). Cells were resuspended in 100 µl containing 25 nM primary antibody (see ‘List of primary antibodies used for microenvironment mapping’) and incubated for 30 min at 4 °C. One hundred microlitres of FACS buffer was added and the cells were centrifuged to remove the primary. The cells were then washed once in 200 µl FACS buffer before resuspension in 100 µl of FACS buffer containing a 1:250 dilution of PE secondary (goat anti-mouse BioLegend 405307 or donkey anti-rabbit BioLegend 406421) for 30 min at 4 °C. One hundred microlitres of FACS buffer was added and the cells were centrifuged to remove the secondary. The cells were then washed once in 200 µl FACS buffer before resuspension in 50 µl fixation buffer (BioLegend, 420801) for 30 min at room temperature in the dark. FACS buffer (150 µl) was added and the cells were centrifuged. The cells were then washed once in 200 µl FACS buffer before resuspension in 150 µl FACS buffer. Samples were then run on a BD LSRFortessa X-20 with BD FACSDiva software v9.2 or kept at 4 °C overnight for next day analysis. Data were analysed using FlowJo, v10 (Supplementary Fig. 5c).
Flow cytometry competitive binding assay
NCI-H1975 cells were collected with Accutase, centrifuged at 800g for 5 min at 4 °C, resuspended in DPBS, counted using a Vi-CELL XR Cell Viability Analyzer and aliquoted at 2 million cells each to low protein binding tubes. Cells were spun down and resuspended in 500 µl cold DPBS. Five micrograms of primary antibody was next added: for EGFR, cetuximab antibody (prepared as described above, obtained from US patent 7,060,80861) or human isotype antibody (BioLegend, 403502) was used; for CDCP1, CDCP1 antibody (BioLegend, 324002) or mouse isotype antibody (BD, 556648) was used. For the competitive sample, 25 µg competing antibody was added immediately before the primary. In the case of EGFR competition, EGFR (BD, 555996) was used; for CDCP1 competition, CDCP1 41A9 (prepared as described above, obtained from US patent 11,702,48162) was used. Samples were incubated for 1.5 h at 4 °C on a rotisserie. Cells were spun down at 800g for 5 min at 4 °C and washed once with 1 ml cold DPBS before resuspension in 500 µl cold DPBS containing Zombie Green Viability dye (1:500 dilution from stock prepared according to manufacturer’s instructions, BioLegend, 423111). Secondary antibody specific for the primary, but not the competing antibody was added—for EGFR competition, goat anti-Human APC (1:100 dilution, R&D Systems, F0135); for CDCP1 competition, goat anti-Mouse APC (1:500 dilution, Thermo Scientific, A865). Samples were incubated for 30 min at 4 °C on a rotisserie. Cells were spun down at 800g for 5 min at 4 °C and washed once with 1 ml cold DPBS before resuspension in 500 µl cold DPBS and transferred to FACS tubes. Samples were then run on a BD Accuri C6 Plus with CSampler Plus. Data were acquired with the BD Accuri CSampler Plus software v1.0.34.1 and analysed using FlowJo, v10 using the previously described gating strategy except the Viability gate utilized the FITC-A channel and the primary antibody was detected with the APC-A channel (Supplementary Fig. 33).
Micromapping of surface proteins in live cells for LC–MS/MS analysis
For two antibody-based micromapping, cells were collected using Accutase and centrifuged at 800g for 5 min at 4 °C before being resuspended in DPBS and counted using a Vi-CELL XR Cell Viability Analyzer. For each condition, 10–20 million cells were aliquoted into each low protein binding tube, with experiments performed in triplicate as independently processed technical replicates (n = 3). The cells were spun down and resuspended in 1 ml cold DPBS containing a targeting primary antibody or an appropriate isotype control (see Supplementary Fig. 34 for a list of primary antibodies used for micromapping) at 1 µg antibody for every million cells and incubated at 4 °C for 30 min on a rotisserie (for example, 10 million cells were resuspended in 1 ml cold DPBS and 10 µg of primary antibody was added). After the primary antibody incubation, cells were spun down and washed twice with 1 ml cold DPBS. The cells were then resuspended in 1 ml cold DPBS containing the secondary antibody conjugated to photocatalyst at 1 µg antibody for every million cells and incubated at 4 °C for 30 min on a rotisserie. Cells were then spun down and washed twice with 1 ml cold DPBS. The cells were resuspended in 1 ml cold DPBS containing 250 µM biotin probe (biotin-tyramide from ApexBio, A80111000). The samples were put in a bio-photoreactor64 for 2 min (for RFT photocatalyst samples) or 3 min (for Ir photocatalyst samples) and irradiated at full intensity. The samples were then spun down and washed twice with 1 ml cold DPBS. The cells were then lysed in one of the two following methods: (1) 1 ml membrane permeabilization buffer (MEM-PER Plus Membrane Fractionation Kit, Thermo Scientific, 89842) with 1× protease inhibitor tablet (Sigma-Aldrich, 4693159001). The samples were then allowed to rotate for 20 min at 4 °C before centrifugation at 16,000g for 15 min at 4 °C. The supernatant was discarded and the membrane pellet was resuspended in 300 µl RIPA (Thermo Scientific, 89901) with 1% sodium dodecyl sulfate (SDS, prepared from a 20% stock, Quality Biological, 351-066-101) and 1× protease inhibitor tablet, sonicated and boiled at 95 °C for 5 min. 1 ml RIPA buffer was added and the lysate was sonicated again to homogenize. (2) Alternatively, the cells were lysed in 1 ml RIPA buffer containing 1× protease inhibitor tablet and 1:1,000 dilution of benzonase (Sigma-Aldrich, 70664-3) and incubated for 15 min at 4 °C on a rotisserie. After lysis, the protein concentrations were measured by BCA assay and stored at −80 °C until the bead enrichment.
Micromapping with directly conjugated photocatalyst antibody was carried out as described above with the following changes. Instead of primary and secondary antibody, an antibody directly conjugated with photocatalyst was added at a molar amount corresponding to 1 µg of full-length antibody for every 1 million cells. A directly photocatalyst-conjugated anti-RSV antibody was used as the isotype control. Lysis was carried out only using the RIPA buffer containing 1× protease inhibitor tablet and 1:1,000 dilution of benzonase.
Following labelling, biotinylated proteins were enriched using streptavidin magnetic beads using either a manual or automated (KingFisher Apex, Thermo Scientific) workflow. In all cases, enrichment followed a common binding and wash procedure, with samples processed either as bead-retained material or by competitive biotin elution, as specified below.
For bead enrichment, 100 or 250 µl of streptavidin magnetic beads (Thermo Scientific, 88817) were washed twice with 1 ml RIPA. Equal protein amounts were added to the beads and the differences in volume were made up with RIPA buffer. The tubes were allowed to rotate 3 h at room temperature. The beads were collected on a magnetic rack and washed three times with 1 ml DPBS containing 1% SDS. Next, the beads were washed three times with 1 ml DPBS containing 1 M NaCl (prepared from a 5 M stock, Research Products International, S24600-500.0) followed by three washes with 1 ml DPBS containing 10% ethanol (200 proof stock, Fisher, BP2818-500) and then one wash with RIPA buffer.
After washing, enriched proteins were processed using one of two workflows. For on-bead digestion, the beads were carried forward directly for downstream proteomic processing. For direct protein elution, proteins were released from the beads by boiling at 95 °C for 10 min in 4× Laemmli buffer (Bio-Rad, 1610747) supplemented with 20 mM DTT (RPI, D11000-10.0) and 25 mM biotin (Sigma-Aldrich, 14400-1G).
Automated bead enrichment was performed using a KingFisher system with the same binding and wash sequence, with wash volumes reduced to 900 µl. In this format, the final RIPA wash was replaced by release of beads into 180 µl of 0.2 M HEPES buffer (pH 8.5; prepared from 0.5 M stock, Thermo Scientific, J63218.AK). Plates were sealed and samples stored at −80 °C prior to proteomic analysis.
Protein extraction and digestion for LC–MS/MS analysis
For direct protein elution, proteins released from the beads were precipitated with trichloroacetic acid and washed with ice-cold acetone. Dried protein pellets were reduced and alkylated by resuspending in 4 M urea with 5 mM tris(2-carboxyethyl) phosphine (TCEP) and 20 mM chloroacetamide (CAA) and incubating at 20 °C for 20 min. Proteins were digested by adding an equal volume of 100 mM Tris-Cl, pH 8.5 with 200 ng lysyl endopeptidase (lysC, FUJIFILM Wako, 125-05061) and shaking overnight at 30 °C then adding an equal volume of 50 mM Tris-Cl, pH 8.5, with 200 ng trypsin (Promega, V5111) and shaking for 6 h at 37 °C. For a subset of micromapping experiments, directly eluted proteins were processed using a previously described method13. For on-bead digestion, bead-enriched lysates were reduced and alkylated on the beads with 5 mM TCEP and 20 mM CAA for 20 min. The beads were then washed with 0.2 M HEPES, pH 8.5 buffer before a 4-h digestion with lysC and overnight digestion with trypsin as above. Digested peptides were pipetted off the beads and one 0.2 M HEPES wash of the beads was performed and added to the digested peptides to recover any remaining peptides from the beads. This protocol was initially performed in microcentrifuge tubes using a magnet rack and manual pipetting and bead mixing. It was later adapted to a 96-well automated workflow using the KingFisher system. For the automated workflow, the separate digestions with lysC and trypsin were combined into a single four-hour step performed on the KingFisher with mixing at 37 °C, with no noticeable effect on digestion efficiency. Following digestion, peptides were labelled with 250 µg tandem mass tag (TMTpro; Thermo Scientific, A52045) isobaric reagents for 2 h at room temperature. Labelling efficiency was checked by pooling 5 µl from each sample within a single plex. For the full experiment, all samples were quenched with hydroxylamine (0.5%) and pooled. Mixes were acidified with TFA (2%) and desalted with SPE-C18 columns (Waters Sep-Pak). Desalted TMT mixes were dried down in a SpeedVac concentrator (Thermo Scientific) and fractionated using the high pH reverse-phase peptide fractionation kit (Pierce) into 13 fractions (5%-50% acetonitrile in 0.1% triethylamine). Every fourth fraction was combined to make 4 pools (1-5-9-13, 2-6-10, 3-7-11, 4-8-12) which were then dried down in a SpeedVac and resuspended in 5% formic acid for LC–MS/MS analysis.
Liquid chromatography
All mass spectrometry experiments used the same liquid chromatography configuration. Peptides were separated on a Vanquish Neo UHPLC system (Thermo Fisher Scientific) operating in direct injection mode at a flow rate of 350 nl min−1 through a 25 cm × 75 µm Aurora Ultimate C18 capillary column (IonOpticks) maintained at 60 °C using a PRSO-V2 column oven (Sonation). Mobile phase A consisted of 0.1% formic acid in water and mobile phase B consisted of 0.1% formic acid in 80% acetonitrile. All data were acquired using an Orbitrap Eclipse Tribrid mass spectrometer (Thermo Fisher Scientific) running Xcalibur v4.0.4084.22, equipped with a nanospray ionization source operating in positive ion mode (spray voltage 2,400 V; ion transfer tube temperature 275 °C).
TMT–SPS–MS3 acquisition of micromap samples
Labelled peptides were separated using an 84-min gradient: 8% to 28% B over 76 min, 28% to 38% B over 5 min, and 38% to 55% B over 3 min, followed by a column wash at 100% B. The mass spectrometer was operated in data-dependent acquisition mode using a 3-s cycle time. Full MS1 survey scans were acquired in the Orbitrap (resolution = 120,000; scan range = 400–1,600 m/z; AGC target = 4 × 10⁵; maximum injection time = 246 ms). Precursor ions were selected from 425–1,600 m/z for fragmentation, restricted to charge states 2–5, with a minimum intensity threshold of 5,000 counts. Dynamic exclusion was applied for 40 s after a single observation using a ±10 ppm mass tolerance window, excluding isotope peaks and limiting selection to one charge state per precursor within each cycle.
Selected precursors were isolated with a 1.0 m/z quadrupole window and fragmented by collision-induced dissociation (CID; NCE = 32%; activation time = 10 ms; activation Q = 0.25) in the linear ion trap (rapid scan rate; AGC target = 2 × 10⁴; maximum injection time = 50 ms). MS2 spectra were searched in real time using the instrument-embedded Real-Time Search65 (RTS) module against a reviewed human protein sequence database with common contaminants. The RTS search used fully tryptic digestion (Trypsin/P) with up to one missed cleavage, static modifications of TMTpro (+304.207 Da) on lysine residues and peptide N termini and carbamidomethylation (+57.021 Da) on cysteine, and a variable modification of oxidation (+15.995 Da) on methionine, with a maximum search time of 40 ms per spectrum. Peptides were accepted for MS3 triggering using charge state-dependent XCorr thresholds (z = 2: XCorr ≥ 1.5, dCn ≥ 0.05; z = 3: XCorr ≥ 2.0, dCn ≥ 0.05; z = 4: XCorr ≥ 2.5, dCn ≥ 0.10; z = 5: XCorr ≥ 3.0, dCn ≥ 0.10) within 10 ppm precursor mass tolerance.
Confidently identified precursors triggered synchronous precursor selection (SPS) MS3 scans, in which up to 8 MS2 product ions were co-isolated using multi-notch quadrupole isolation66 (MS2 isolation window = 2.0 m/z; MS3 quadrupole isolation window = 1.3 m/z) and fragmented by HCD (NCE = 45%). TMTpro reporter ions were detected in the Orbitrap (resolution = 50,000; scan range = 110–400 m/z; AGC target = 5 × 10⁵; maximum injection time = 1,000 ms).
TMT–SPS–MS3 data analysis of micromap samples
Raw files were processed using Thermo Proteome Discoverer (v3.0.1). Peptide and protein identification used SEQUEST HT with INFERYS rescoring and Percolator validation against the canonical human proteome (UniProtKB UP000005640, release 2024_08; 20,420 entries) supplemented with a common contaminants database and an equal-size concatenated reversed-sequence decoy database. Searches required fully tryptic cleavage (Trypsin/P) with up to two missed cleavages, a precursor mass tolerance of 20 ppm, and a fragment ion tolerance of 1.005 Da. TMTpro (+304.207 Da) was set as a static modification on lysine residues and peptide N termini; carbamidomethylation (+57.021 Da) on cysteine was set as a static modification; and oxidation (+15.995 Da) on methionine was set as a variable modification. PSM confidence was assessed by Percolator using INFERYS-derived spectral prediction features in a semi-supervised SVM framework, and results were filtered to 1% FDR (strict) and 2% FDR (relaxed) at both the peptide and protein levels. Protein grouping was performed using the strict parsimony principle.
TMTpro reporter ion quantification was performed on Orbitrap MS3 spectra using signal-to-noise (S/N) ratios integrated within a 15 ppm window using the most confident centroid method. Quantification spectra were required to meet the following quality thresholds: average reporter ion S/N ≥ 15, precursor co-isolation interference <50%, and SPS ion mass matches ≥65%. Only TMTpro-labelled peptides were used for quantification; unique and razor peptides were included. A minimum channel occupancy of 25% was required per quantification spectrum. Isotopic impurity correction was applied using lot-specific correction factors supplied by the manufacturer. Protein abundances were calculated by summing peptide-level S/N values and normalized to total peptide amount within each plex.
Experiments were multiplexed using TMTpro 18-plex reagents. Each individual plex comprised between 6 and 18 samples — one isotype control condition and one to five antibody-targeted conditions, with three technical replicates per condition. Quantitative comparisons were made between each targeted condition and the isotype control within the same plex.
Tables containing RTK micromap enrichment values (log2 fold change and associated statistical metrics) are provided in Supplementary Table 1.
Sample preparation for whole-cell and patient tumour proteomic analysis
Whole-cell extracts were generated for cells listed in Supplementary Fig. 4a. Three technical replicates of 5 × 10⁵ cells were lysed in parallel in 96-well plates. Before aliquoting, washed cell pellets were resuspended in ice-cold PBS at 1.1 × 10⁷ cells per ml and 45 µl was transferred to the lysis tube or plate. Cells were pre-treated for 10 min on ice with Pierce Universal Nuclease (125 U total, 88701) and lysed by the addition of 50 µl of 2× lysis buffer (100 mM HEPES pH 8.5, 1% SDS, 2% sodium deoxycholic acid, 2 mM MgCl2, 100 mM NaCl, 10 mM TCEP, 40 mM CAA, 1× protease inhibitor). The cells were incubated with mixing at 37 °C for 10 min. 10 µl of 20% SDS was added to bring the final concentration to >2% and the samples were mixed for an additional 10 min at 70 °C. Protein concentrations were measured using the Pierce reducing agent compatible BCA kit (Thermo Scientific, 23250).
Frozen human tumour and normal tissue samples analysed in Supplementary Fig. 24 were obtained from Audubon Bioscience (see Supplementary Table 2 for a list of patient information for tissue samples). Samples were cut on ice with a clean scalpel, blotted dry to remove excess liquid, weighed, and stored at −80 °C. For whole-cell extract analysis, aliquots of approximately 10 mg were lysed in microcentrifuge tubes using the procedure described above for cultured cells with the following alterations. Prior to lysis, tissue samples were washed 4 times with ice-cold PBS to remove blood and preincubated with 20 µl of nuclease solution before adding 100 µl of 1× lysis buffer and grinding with a plastic SpiralPestle (RPI, 2999017) driven by a rotary pestle motor (Cole-Parmer, EW-44468-25) for 30 s. The pestle was washed with an additional 100 µl of lysis buffer to remove residual lysate and the samples were mixed at 37 °C for 10 min before the addition of 1/10 volume 20% SDS and a final mixing incubation at 70 °C for 10 min. Samples were cleared by centrifugation and the supernatant was transferred to fresh tubes. Protein concentrations were measured by BCA analysis as previously described. Larger aliquots (around 30 mg) of tissue samples were also processed to isolate plasma membrane fractions using the Minute Plasma Membrane fractionation kit (Invent, SM-005) per the manufacturer’s protocol. For all cultured cell and tissue samples, we digested 10 µg of total protein using the SP3 method67 with lysC and trypsin. The resulting peptides were desalted using Supel Swift HLB dispersive tips (DPX Technologies, DPX170501), eluted with 70% acetonitrile, dried in a SpeedVac, and resuspended in 5% formic acid.
Proteome profiling via DIA acquisition
Peptides (200–500 ng) from whole-cell or patient tumour and normal samples were loaded and separated using a 93-min gradient: 5% B held for 3 min, increasing to 28% B over 73 min, then 28% to 36% B over 7 min, and 36% to 50% B over 4 min, followed by a column wash at 100% B.
The mass spectrometer was operated in data-independent acquisition (DIA) mode. MS1 survey scans were acquired in the Orbitrap (resolution = 60,000; scan range = 380–985 m/z; AGC target = 4 × 10⁵; maximum injection time = 100 ms). Each survey scan was followed by 60 DIA MS2 scans using fixed 10 m/z isolation windows with 1 m/z overlap and instrument-optimized window placement, covering a precursor mass range of 380–980 m/z. MS2 fragment ions were detected in the Orbitrap across a scan range of 145–1,450 m/z (resolution = 15,000; HCD NCE = 30%; AGC target = 1 × 10⁵; maximum injection time = 40 ms) in centroid mode. The total DIA cycle time was 3 s.
DIA data analysis of whole-cell proteomes
DIA raw files were analysed using Spectronaut (v20.5.260227; Biognosys AG) in directDIA+ (Deep) mode against the canonical human proteome (UniProtKB UP000005640, release 2024_08; 20,420 entries) supplemented with a custom contaminants database (38 entries). The Pulsar search engine was used with fully specific tryptic digestion (Trypsin/P), up to two missed cleavages, and peptide lengths of 7–52 residues. Fixed modifications included carbamidomethylation of cysteine; variable modifications included oxidation of methionine and acetylation of protein N termini, with a maximum of two variable modifications per peptide. Decoys were generated using a mutated sequence strategy with a dynamic decoy limit set to 10% of the library size. Mass tolerances for both MS1 and MS2 were determined dynamically for each run using Spectronaut’s automated calibration. Retention time calibration used deep learning-assisted iRT regression with non-linear local regression and automated iRT source assignment.
Precursor identification was controlled at 1% q-value at both the run and experiment levels; protein group identification was controlled at 1% q-value at the experiment level and 5% at the run level, with single-hit proteins assessed using a stratified FDR rule. Protein inference was performed using the IDPicker algorithm. Quantification was based on MS2 peak areas extracted within dynamically determined retention time and mass tolerance windows. Protein abundances were computed by summing the mean MS2 area of the top 3 precursors per peptide sequence, using up to the top 5 peptides per protein group. Interference correction was applied using only confidently identified peptides, requiring a minimum of 2 MS1 and 3 MS2 observations, with multi-channel interferences excluded. Cross-run normalization used Spectronaut’s automatic normalization strategy anchored exclusively to human proteome FASTA entries, excluding contaminant proteins. Quantities were reported at the protein group level across the full experiment.
Cell copy number quantification using proteomic ruler method
Absolute protein copy numbers used for analyses in Supplementary Figs. 13 and 20 were calculated using the proteomic ruler approach68. For each cell line, the total proteomic signal was summed across all quantified proteins, and a separate sum was computed over a fixed set of histone proteins. The histone signal fraction was calculated as the histone signal divided by the total proteomic signal. The cellular DNA mass was determined as 6.5 pg × (ploidy/2), with ploidy values obtained from DepMap (OmicsGlobalSignatures.csv) (DepMap, Broad (2026). DepMap Public 26Q1. Dataset. https://depmap.org) and a diploid state (ploidy = 2) assumed for cell lines lacking ploidy. The total protein mass per cell was derived as the histone mass divided by the histone signal fraction. The mass of each individual protein was then computed as its fractional share of the total signal (protein signal/total signal) multiplied by the total protein mass per cell. Finally, protein masses were converted to copy numbers per cell by dividing the protein mass by its molecular weight and multiplying by Avogadro’s number.
Corresponding protein abundance measurements for cells listed in Supplementary Fig. 4a are provided in Supplementary Table 3.
EGFR immunoprecipitation and mass spectrometry analysis
Five million cells were aliquoted to low protein binding tubes and washed once in cold DPBS. Cells were lysed in 550 µl 40 mM HEPES pH 7.4, 150 mM NaCl, 1× Halt Protease and Phosphatase Inhibitor Cocktail, EDTA-free (Thermo Scientific, 78441), 2 mM EDTA, 1% (w/v) freshly prepared n-dodecyl β-D-maltoside detergent and vortexed for 10 s. Samples were kept on ice for 30 min and vortexed for 10 s every 10 min. Lysates were then centrifuged at 16,000g for 15 min at 4 °C. Five hundred microlitres of supernatant was transferred to a KingFisher deepwell plate (Thermo Scientific, 95040450B). Five micrograms of primary antibody (biotinylated EGFR clone 528 (Santa Cruz Biotechnology, sc-120b), EGFR clone EGFR.1 (BD, 555996) or Cetuximab (R&D Systems, MAB9577-100)) or isotype (biotinylated mouse isotype (Thermo Scientific, 13-4714-85), mouse isotype (BD, 556648) or human isotype (Biolegend, 403502)), was added to each well before transferring to the Kingfisher Apex. Lysates with the primary antibody were mixed for 30 min at 4 °C. Fifty microlitres of streptavidin magnetic beads (Thermo Scientific, 88817) or protein A/G magnetic beads (Thermo Scientific, 88802) were mixed with 550 µl Pierce IP Lysis Buffer (Thermo Scientific, 87787) and subsequently washed twice with 900 µl Pierce IP Lysis Buffer. Preincubated lysates were then mixed with the magnetic beads for 1 h at 4 °C before washing the beads four times with 900 µl Pierce IP Lysis Buffer. Proteins were eluted from the beads by mixing with 50 µl Pierce IgG Elution Buffer (Thermo Scientific, 21004) for 10 min at room temperature twice. The two eluate fractions were pooled and mixed with 15 µl 1 M Tris pH 7.4 to neutralize. Samples were stored at −80 °C prior to proteomic analysis.
The eluted immunocomplexes were processed and analysed using the same methods described for cell extracts above. The samples were first reduced and alkylated with TCEP and chloroacetamide. Proteins were collected, washed, digested with lysC and trypsin, and desalted using the SP3 method HLB dispersive tips. Samples were analysed using a 30 min data-independent acquisition method on the Orbitrap Eclipse with all other parameters the same as for cell extracts and searched in Spectronaut using the same schema with all runs grouped together to enable match between runs. Cross-run normalization was omitted, as it relies on higher sample uniformity than present in immunoprecipitations with different antibodies and systems.
Analysis of RTK expression and signalling-state diversity across mapped cell lines
Cancer Cell Line Encyclopedia (CCLE) reverse-phase protein array (RPPA) phospho-signalling heat map and RPPA data were obtained from the CCLE69, using the CCLE_RPPA_20181003 level-4 matrix and the CCLE_RPPA_Ab_info_20181226 antibody annotation table. Of the 28 study cell lines, 26 were present in CCLE RPPA (BT549 and CACO2 had no RPPA data and were excluded). A 16-antibody panel was selected to span RTK-direct phospho-epitopes (for example, EGFR pY1068/pY1173, HER2 pY1248, HER3 pY1289 and MET pY1235) and core downstream effectors of the RAS–MAPK, PI3K–AKT–mTOR and STAT axes. The _Caution suffix on raw CCLE antibody names denotes the MD Anderson RPPA Core validation tier; it was retained as a validation annotation and stripped from display labels. Each antibody was z-scored across the 26 matched lines, and CCLE mRNA abundance [log2(TPM + 1)] for the 12 study RTKs was likewise z-scored across the same lines. The two matrices were displayed as stacked heat maps sharing a common cell line axis, with columns ordered by Ward hierarchical clustering of the combined z-score matrix and the colour scale (RdBu_r) clipped at ±2.5z. Analyses were performed in Python 3.10+ using pandas ≥2.1, NumPy ≥1.26, SciPy ≥1.11, and matplotlib/seaborn.
Bioinformatic analysis of micromapping experiments
Primary bioinformatic analysis of LC–MS/MS data was performed in the R statistical computing environment. Peptide-level abundance data were used to identify the number of peptides corresponding to each protein. To normalize for loading differences, peptide abundance was normalized to the summed total abundance for each sample; these totals were averaged, and individual normalized values were rescaled by this average. Peptide-level data were then merged to protein-level data by calculating the median of all peptides assigned to a given protein.
Differential protein enrichment was subsequently assessed using the limma R package (v3.64.3). log2-transformed summed intensity values were used to calculate statistical significance, reporting t-statistics and P values. A linear model was fit to each protein and an empirical Bayes procedure moderated the per protein residual variances by shrinking them toward a common prior, yielding a two-sided moderated t-statistic and corresponding P value for the target-versus-control contrast. To account for multiple hypothesis testing, P values were adjusted using the Benjamini–Hochberg procedure. Results were visualized using Seaborn, generating volcano plots that display log2 fold change against the negative log10-transformed adjusted P values.
Proximity interaction networks
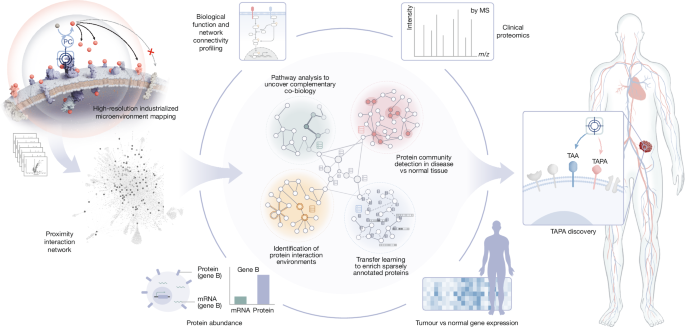
Global RTK proximity network was constructed using the NetworkX Python library ≥3.2, where edges connected experimental target proteins to enriched proteins. We applied permissive enrichment thresholds (log2FC > 0.1, q-value < 0.2) to define edges, ensuring the inclusion of lower-affinity or transient interactions. The resulting network topology was exported in GEXF format and spatialized in Gephi using the ForceAtlas2 layout algorithm (LinLog mode).
The RTK–RTK interaction network in Fig. 2c was constructed in NetworkX from previously reported3, literature-curated RTK heterointeractions, augmented with high-confidence intra-family interactions from STRING (experimental score > 0.7). By contrast, analyses in Fig. 2e,f were evaluated against a broader, more inclusive reference set integrating multiple interaction databases (STRING23, CORUM24, BioGRID25, IntAct26), enabling assessment against less stringent but more comprehensive interaction annotations. Metrics were calculated as described in ‘Evaluation metrics’. The computational graph was exported to Gephi for final formatting.
Overlap and similarity analysis
To systematically compare RTK interactomes across targets, we generated a two-dimensional array of pairwise comparisons. Overlaps were visualized as area-proportional Venn diagrams using matplotlib-venn, with circle sizes weighted by the total number of enriched proteins. The Jaccard index was computed to quantify set similarity (J = |A ∩ B“https://www.nature.com/”A ∪ B|). To facilitate interpretation, conditions were ordered by Euclidean distance, placing phenotypes with the greatest overlap in proximity.
Score normalization
Raw t-statistics were normalized using robust z-score transformation applied independently within each experiment. The robust z-score was computed as:
$${z}_{i}=\frac{{t}_{i}-{\rm{median}}
Source link

Related Posts

コロラド対ジョージア工科大学
- アーンドラ プラデーシュ州のニュース
- アーンドラ・プラデーシュ州でガウルが罠から救出された
- September 12, 2026
- 0 Comments
アーンドラ・プラデシュ州のパピコンダ国立公園でインドのガウルが罠から救出された
9月10日、ポラバラム地区のパピコンダ国立公園でメスのインドガウリが森林当局によって救出された。写真提供: 特別手配 森林当局は体重750kgの雌のインドガウルを救出した(どうぞ)は、アーンドラ・プラデシュ州ポラバラム地区にあるパピコンダ国立公園(PNP)の生態学的に敏感な地域で、密猟者が設置したワイヤートラップに捕獲されました。 森林当局は9月10日、ランパチョダヴァラム森林区のインドクル保護林で閉じ込められたガウリを発見し、救助活動を開始した。 森林管理官ランパチョダヴァラム・シヴァクマール・ガンガルが率いる森林当局と獣医師のチームがインドのガウリを救出した。 「救出されたインドのガウリは、高度な獣医ケア、リハビリテーション、初期治療後の怪我の迅速な回復のためにヴィシャカパトナム動物救助センターに送られた」とガンガル氏は述べた。 動物はARCヴィシャカパトナムでの治療に反応し、回復の兆候を示していると当局者が土曜日に述べた。ゴダヴァリ渓谷のパピコンダ山脈は、かつてはインドのガウリが生育する「バイソンヒルズ」として知られていました。 発行済み – 2026 年 9 月 12 日午後 7 時 49 分(IST) Source link

- September 12, 2026
- 0 Comments
Google ニュース
BVB トレーナー Niko Kovac verkündet gute Neuigkeiten von Konstantinos Karetsasスポックス 16:13 フォルトゥナ vs. シュトラーセンバーン・ダービー for MSV – カンタージーク for RWEn-tv.de Karetsas に関する BVB アップデート: 「3 つの目標は、コップの概念であり、どのようなものでもありません」キッカー Karetsas vor schnellem BVB-Comeback:…